Graphic organizer maker for any lesson
Describe the organizer you want, with your own headings, and print it for the class.
Make a graphic organizerA graphic organizer gives students a place to put their thinking: what two things share, what they already know, how a story is built, or why something happened. You know which one the lesson needs. The hard part is finding a version with the right headings, the right amount of writing space, and nothing your students do not need.
With TeachFigs you describe it instead: "A Venn diagram comparing the book and the movie, with writing lines in each part." "A KWL chart for our unit on weather." "A story map with boxes for characters, setting, problem, events and solution." Choose the Worksheet style for clean black lines that photocopy well, or K-12 textbook for soft color on a screen or a poster. The four organizers below were made this way, and each caption shows the prompt that made it.
Use the same organizer across subjects. A Venn diagram compares two characters in reading, two shapes in math, two communities in social studies, or frogs and toads in science. A cause-and-effect chart works for a story, a history event, or a classroom rule. A KWL chart opens any unit. Write the headings you want in quotation marks so the page prints exactly those words.
Match the page to your students. For young learners, ask for fewer boxes, larger lines, and a small picture beside each heading. For older students, ask for more rows, or for a box for evidence. If you want an organizer with an answer key, for example a story map already filled in for one book, use Worksheet mode, which makes the student page and a matching key.
Check the printout before class: headings spelled correctly, enough room to write, and nothing extra. If it is not right, change the description and make it again.
Example figures
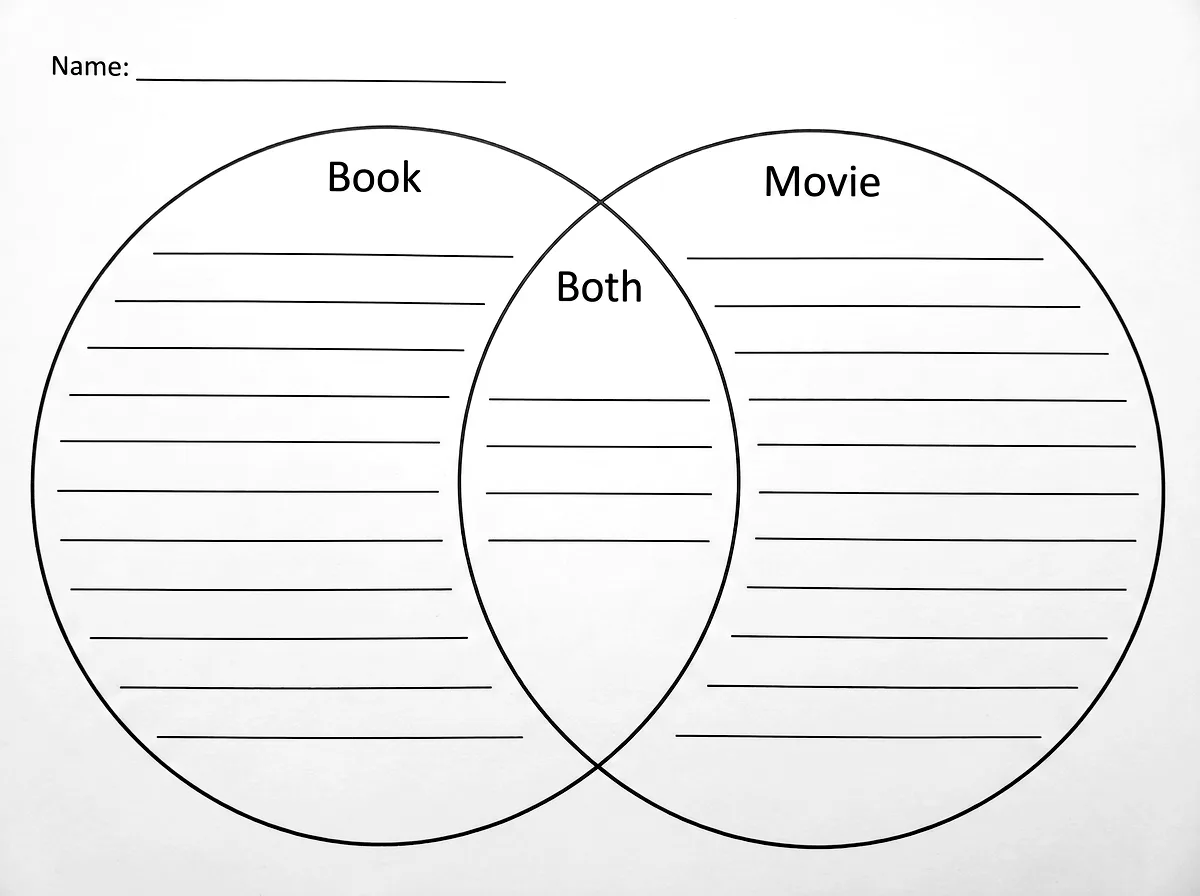
Prompt
Worksheet style, 4:3. Prompt: A blank Venn diagram graphic organizer for comparing a book and its movie: two large overlapping circles, the left circle headed "Book", the right circle headed "Movie", the overlap headed "Both", with empty writing lines inside each of the three sections and a "Name: ________" line at the top left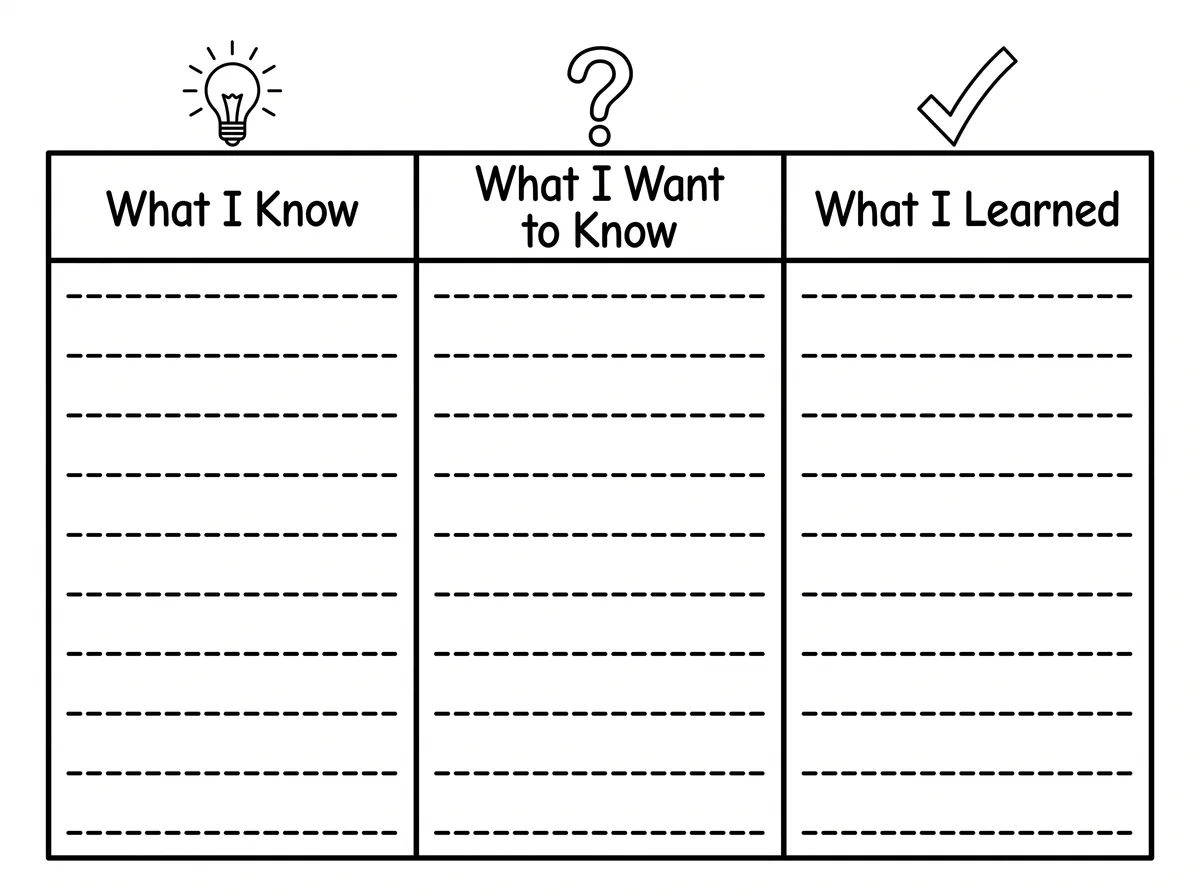
Prompt
Worksheet style, 4:3. Prompt: A blank KWL chart graphic organizer: three tall columns with headings "What I Know", "What I Want to Know", "What I Learned", a small simple icon above each heading (a light bulb, a question mark, a check mark), and empty writing lines in every column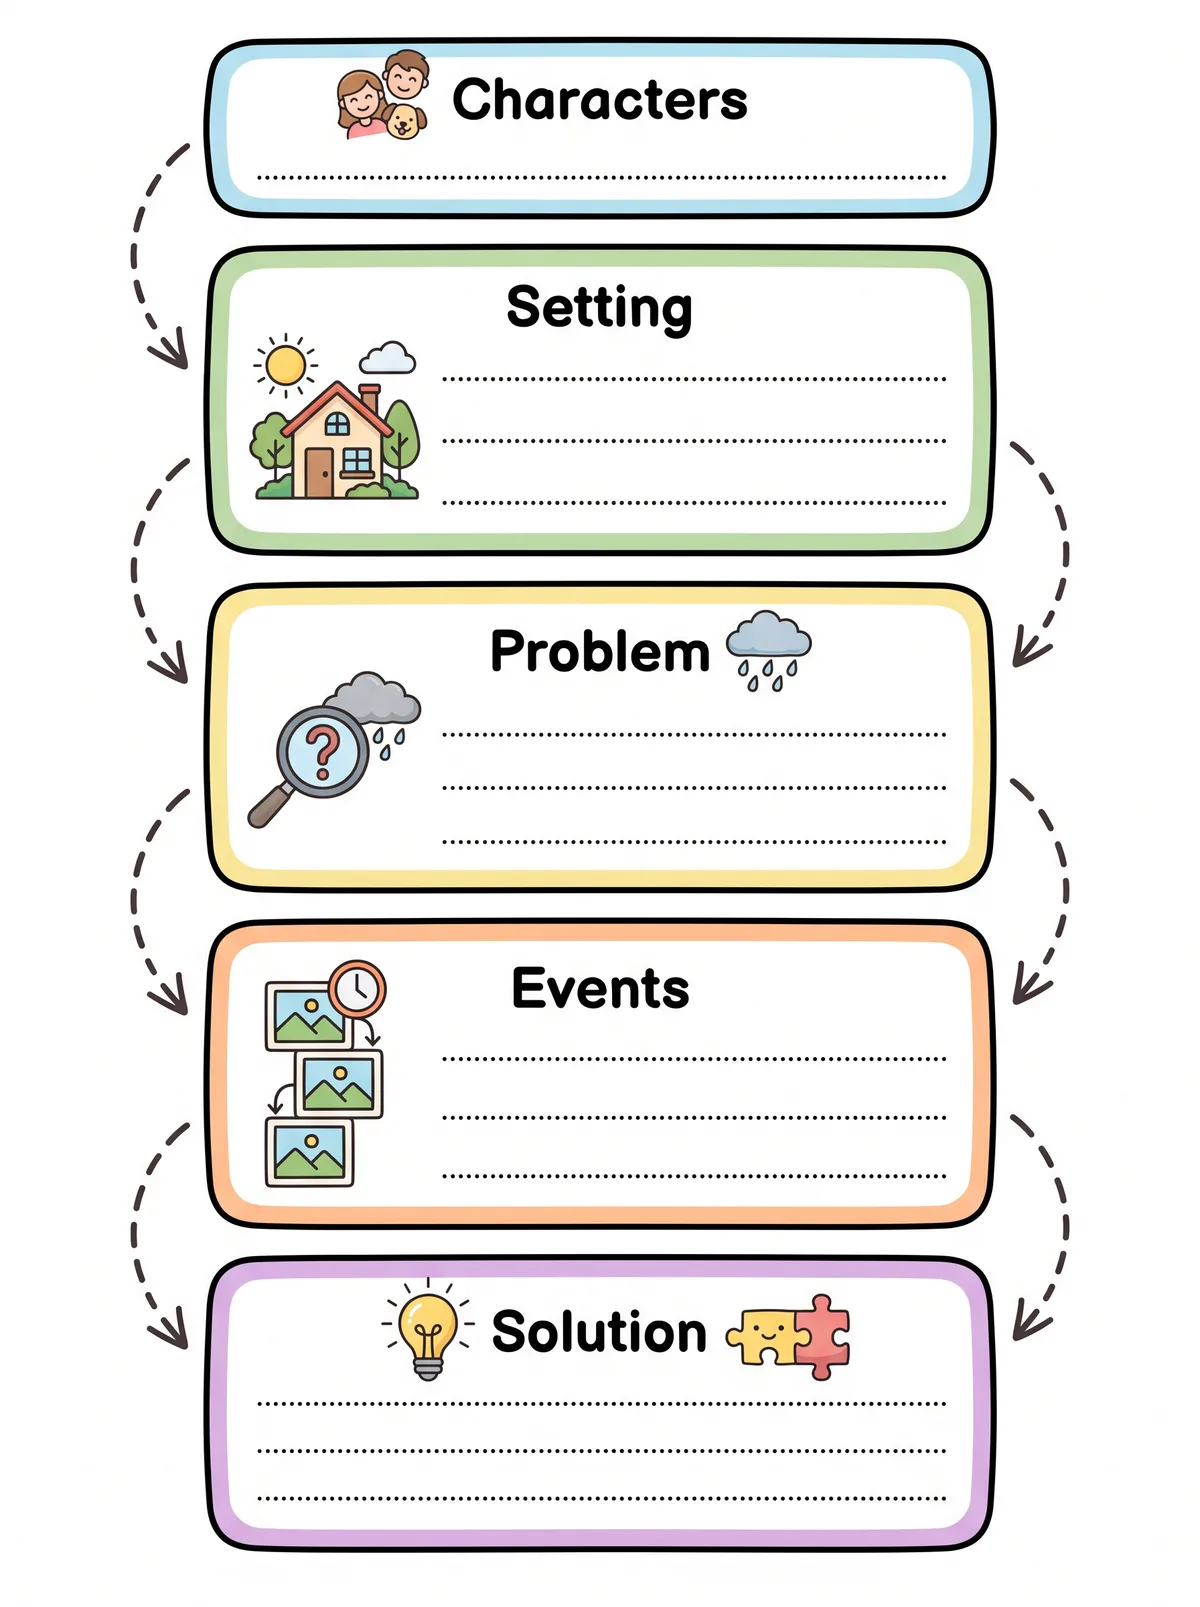
Prompt
K-12 Textbook style, 3:4. Prompt: A blank story map graphic organizer for grades 1 to 3: five rounded boxes connected by arrows from top to bottom, headed "Characters", "Setting", "Problem", "Events", "Solution", each box with a small friendly icon and empty writing lines, soft pastel box colors on white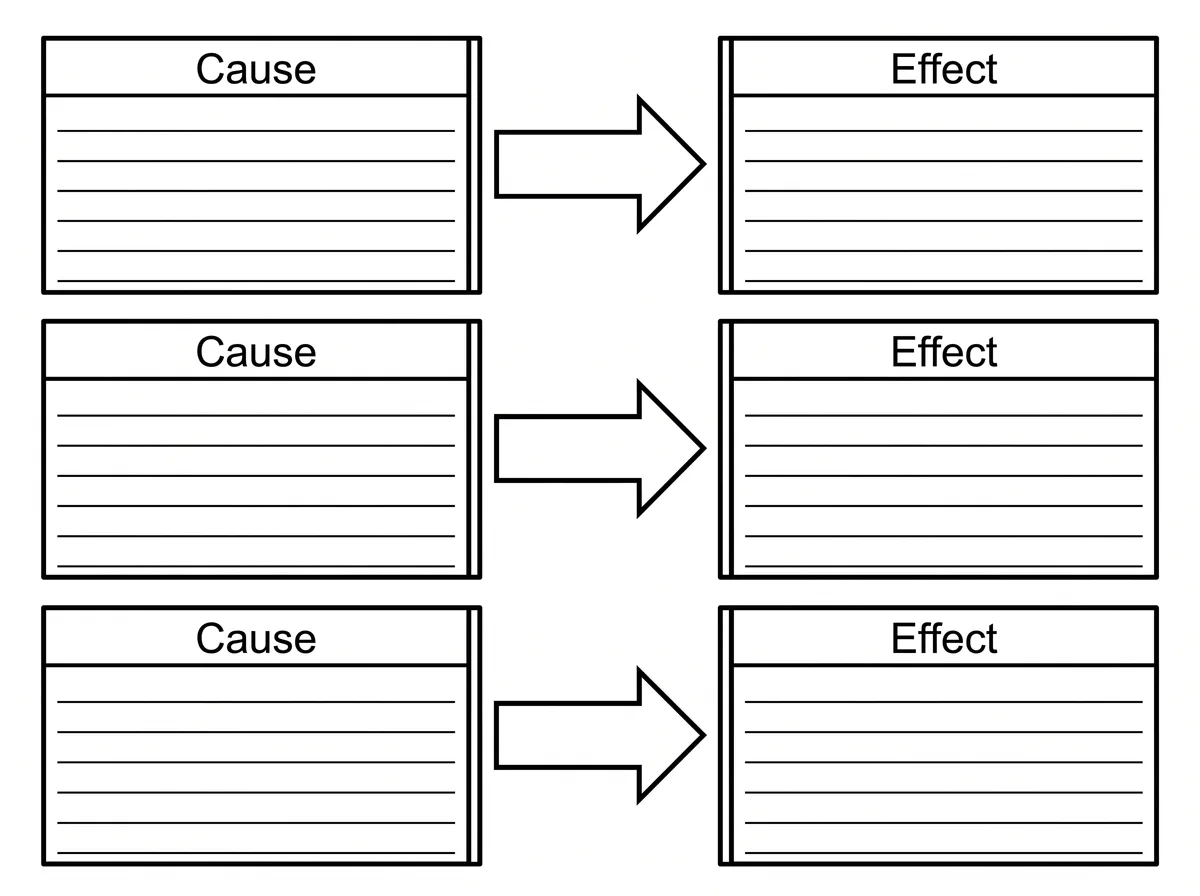
Prompt
Worksheet style, 4:3. Prompt: A blank cause and effect graphic organizer: three rows, each row a box headed "Cause" on the left, a thick arrow pointing right, and a box headed "Effect" on the right, with empty writing lines inside every boxHow it works
Name the organizer and its headings
Say which organizer you want and put the exact headings in quotation marks, for example a KWL chart with "What I Know", "What I Want to Know" and "What I Learned".
Choose a style and size
Worksheet style prints as clean black lines for copying. K-12 textbook adds soft color for slides and posters. Choose a portrait or landscape shape.
Check it and print
Make sure every heading is spelled right and there is room to write. Change the description and make it again if you need more space or fewer boxes.
Which graphic organizers can I make?
Any you can describe: Venn diagrams, KWL charts, story maps, cause-and-effect charts, sequence chains, T-charts, main idea and details, word maps, timelines, and concept maps. Name the headings and the number of boxes you want.
Can I make one for a specific book or unit?
Yes. Put the book title, unit or topic into the description and the headings you want. If you want the organizer filled in as an answer key too, use Worksheet mode, which makes the student page and a matching key.
Will it print in black and white?
Choose the Worksheet style for black lines on white that photocopy well. The Venn diagram, KWL chart and cause-and-effect chart on this page used that style.
Can I adapt it for younger students or students who need more support?
Ask for fewer boxes, larger writing lines, a small picture next to each heading, or sentence starters in each box. For older students, ask for more rows or a box for evidence.